Advanced Static analysis
In Advanced Static Analysis, we will move further and reverse engineer malware into the disassembled code and analyze the assembly instructions to understand the malware's core functionality in a better way.
Advanced static analysis is a technique used to analyze the code and structure of malware without executing it. This can help us identify the malware's behavior and weaknesses and develop signatures for antivirus software to detect it. By analyzing the code and structure of malware, researchers can also better understand how it works and develop new techniques for defending against it.
Malware analysis overview
| Technique | Description |
|---|---|
| Basic static analysis | Aims to understand the malware's structure. Involves examining the malware's code, file headers, and other static properties. |
| Advanced static analysis | Aims to uncover hidden or obfuscated code and functionality within the malware. Involves using more advanced techniques to analyze the malware's code, such as deobfuscation and code emulation. |
| Basic dynamic analysis | Aims to observe the malware's behavior during execution in a controlled environment. Involves executing the malware in a sandbox or virtual machine and monitoring its system activity, network traffic, and process behavior. |
| Advanced dynamic analysis | Aims to uncover more complex and evasive malware behavior using advanced monitoring techniques. Involves using more sophisticated sandboxes and monitoring tools to capture the malware's behavior in greater detail. |
How advanced static analysis is performed
To perform advanced static analysis, disassemblers such as IDA Pro, Binary Ninja, and radare2 are commonly used. These disassemblers allow the analyst to explore the malware's code and identify its functions and data structures.
The steps involved in performing advanced static analysis of malware are as follows:
- Identify the
entry pointof the malware and thesystem callsit makes. - Identify the malware's
code sectionsand analyze them using available tools such asdebuggersandhex editors. - Analyze the malware's
control flowgraph to identify itsexecution path. - Trace the malware's dynamic behavior by
analyzing the system callsit makes during execution. - Use the above information to understand the malware's
evasion techniquesand thepotential damage it can cause.
Ghidra
Many disassemblers like Cutter, radare2, Ghidra, and IDA Pro can be used to disassemble malware. However, we will explore Ghidra because it's free, open-source, and has many features that can be utilized to get proficient in reverse engineering.
Warning
The objective is to get comfortable with the main usage of a disassembler and use that knowledge to use any disassembler.
Ghidra is a software reverse engineering tool that allows users to analyze compiled code to understand its functionality. It is designed to help analysts and developers understand how the software works by providing a platform to decompile, disassemble, and debug binaries.
Ghidra includes many features that make it a powerful reverse engineering tool. Some of these features include:
Decompilation: Ghidra candecompilebinariesinto readable C code, making it easier for developers to understand how the software works.Disassembly: Ghidra candisassemblebinariesinto assembly language, allowing analysts to examine the low-level operations of the code.Debugging: Ghidra has a built-indebuggerthat allows users tostep throughcode and examine its behavior.Analysis: Ghidra canautomatically identify functions,variables, andother codeto help users understand thestructure of the code.
How to use Ghidra
- Open Ghidra and create a
new project. -
Select
Non-Shared Project.Selecting Shared Project would allow us to share our analysis with other analysts.
-
Name the project and
set the directoryor leave the default path. Importthe executable you want to analyze. Now that we have created an empty project, let's Drag & Drop the executable and select the program.- Once it's imported, it shows us the summary of the program.
Double-click on the .exeto open it in the Code Browser. When asked to analyze the executable,click on Yes.- The next window that appears shows us various analysis options. We can
check or uncheck them based on our needs. These plug-ins or add-ons assist Ghidra during the analysis. - It will take some time to analyze. The bar on the bottom-right shows the progress.
Waituntil the analysis is 100%.
Ghidra layout
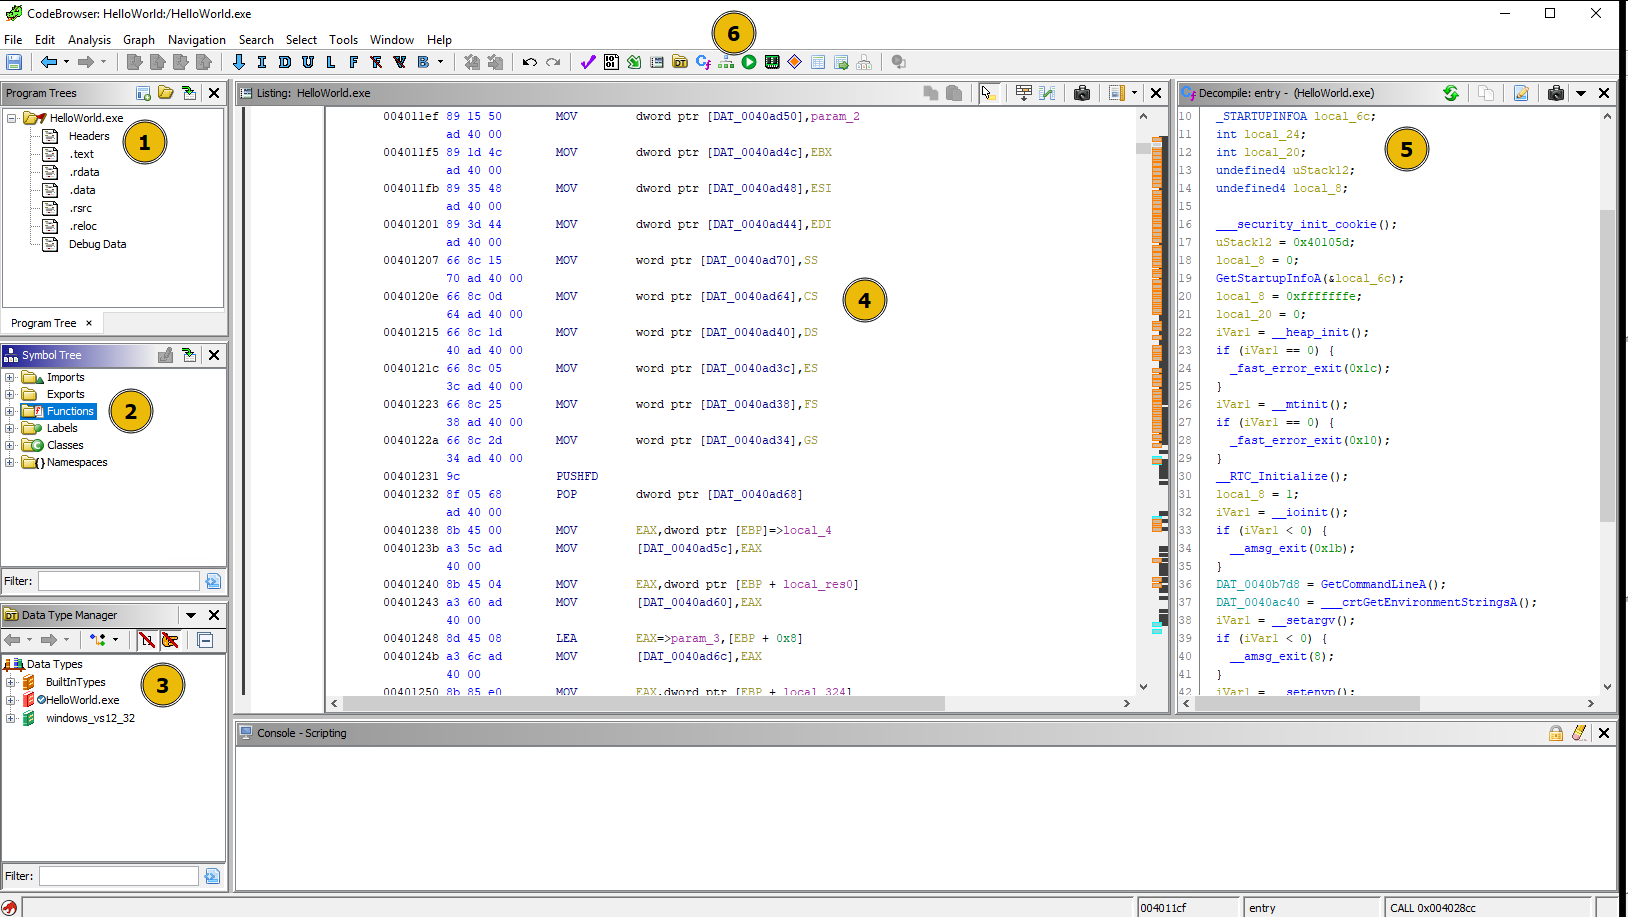
-
Program Trees: Shows (PE) sections of the program. We can click on different sections to see the content within each. -
Symbol Tree:Imports: This section contains information about thelibraries being importedby the program. Clicking on each API call shows the assembly code that uses that API.Exports: This section contains the API/function calls being exported by the program. This section isuseful when analyzing a DLL, as it will show all the functions dll contains.Functions: This section contains the functions it finds within the code. Clicking on each function will take us to the disassembled code of that function. It also contains theentry function. Clicking on the entry function will take us to thestart of the programwe are analyzing. Functions withgeneric namesstarting withFUN_VirtualAddressare the ones thatGhidra does not give any names to.
-
Data Type Manager: This section shows various data types found in the program. -
Listing: This window shows the disassembled code of the binary, which includes the following values in order.Virtual AddressOpcodeAssembly Instruction (PUSH, POP, ADD, XOR, etc.)OperandsComments
-
Decompile: Ghidra translates the assembly code into apseudo C codehere. This is a very important section to look at during analysis as it gives a better understanding of the assembly code. -
Toolbar: It has variousoptions to useduring the analysis. -
Graph View: The Graph View in the toolbar is an important option, allowing us to see the graph view of the disassembly: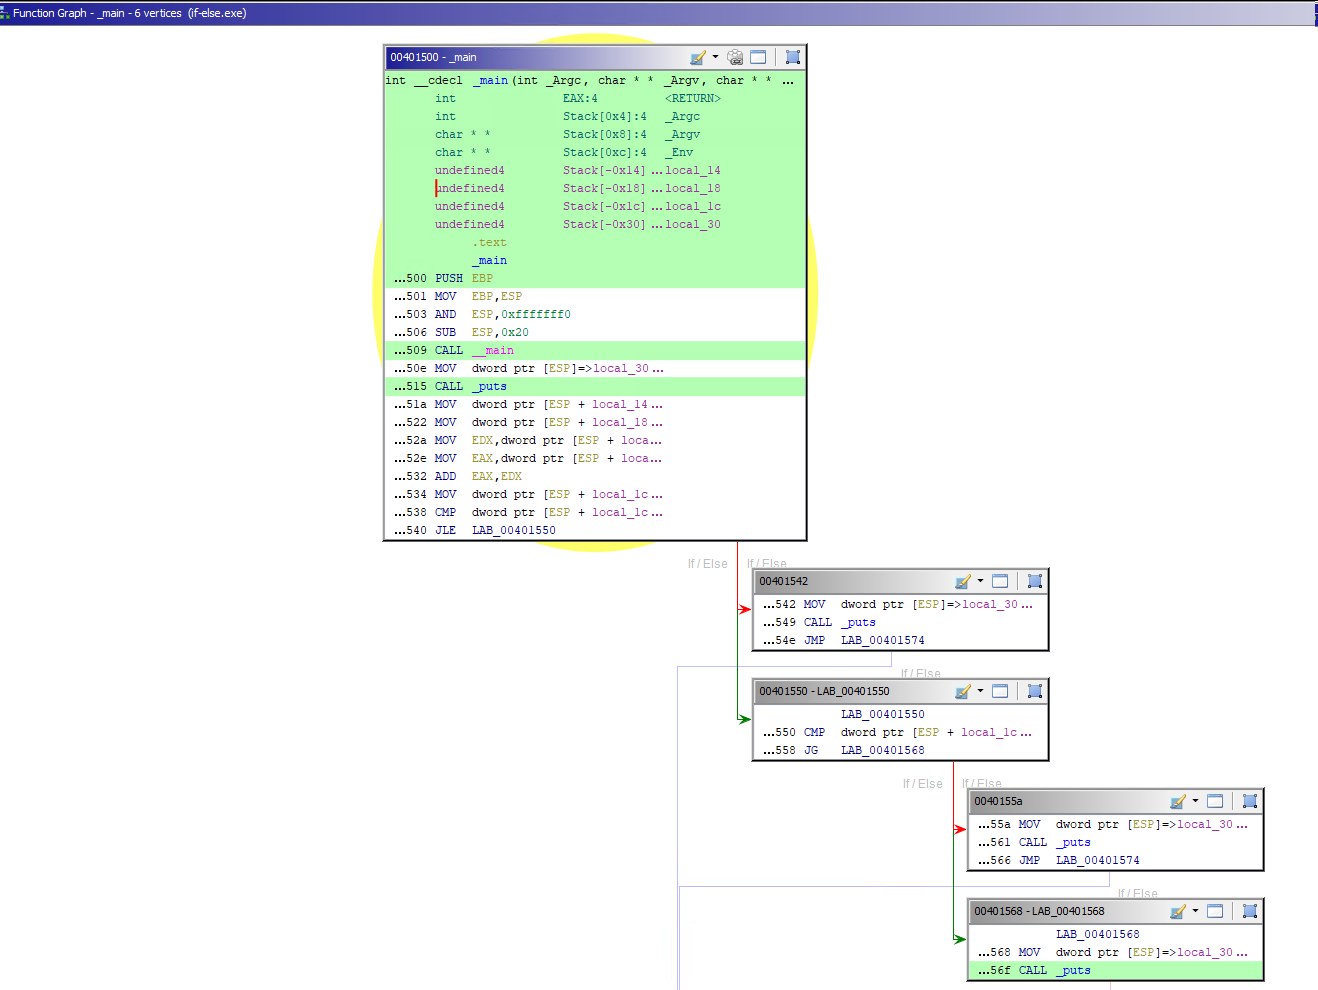
-
The
Memory Mapoption shows the memory mapping of the program as shown below: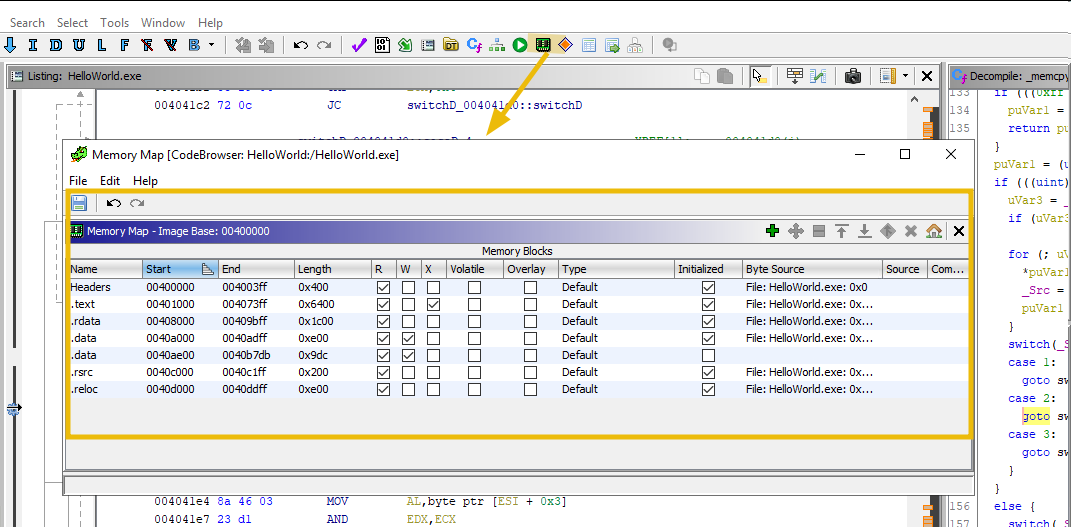
-
This
navigation toolbarshows different options to navigate through the code.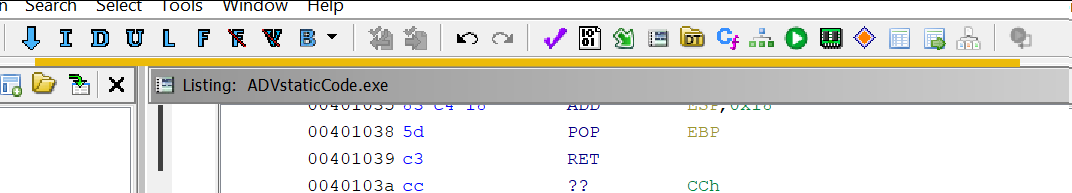
-
Explore Strings. Go toSearch -> For Stringsand click Search will give us the strings that Ghidra finds within the program. This window can contain very juicy information to help us during the analysis.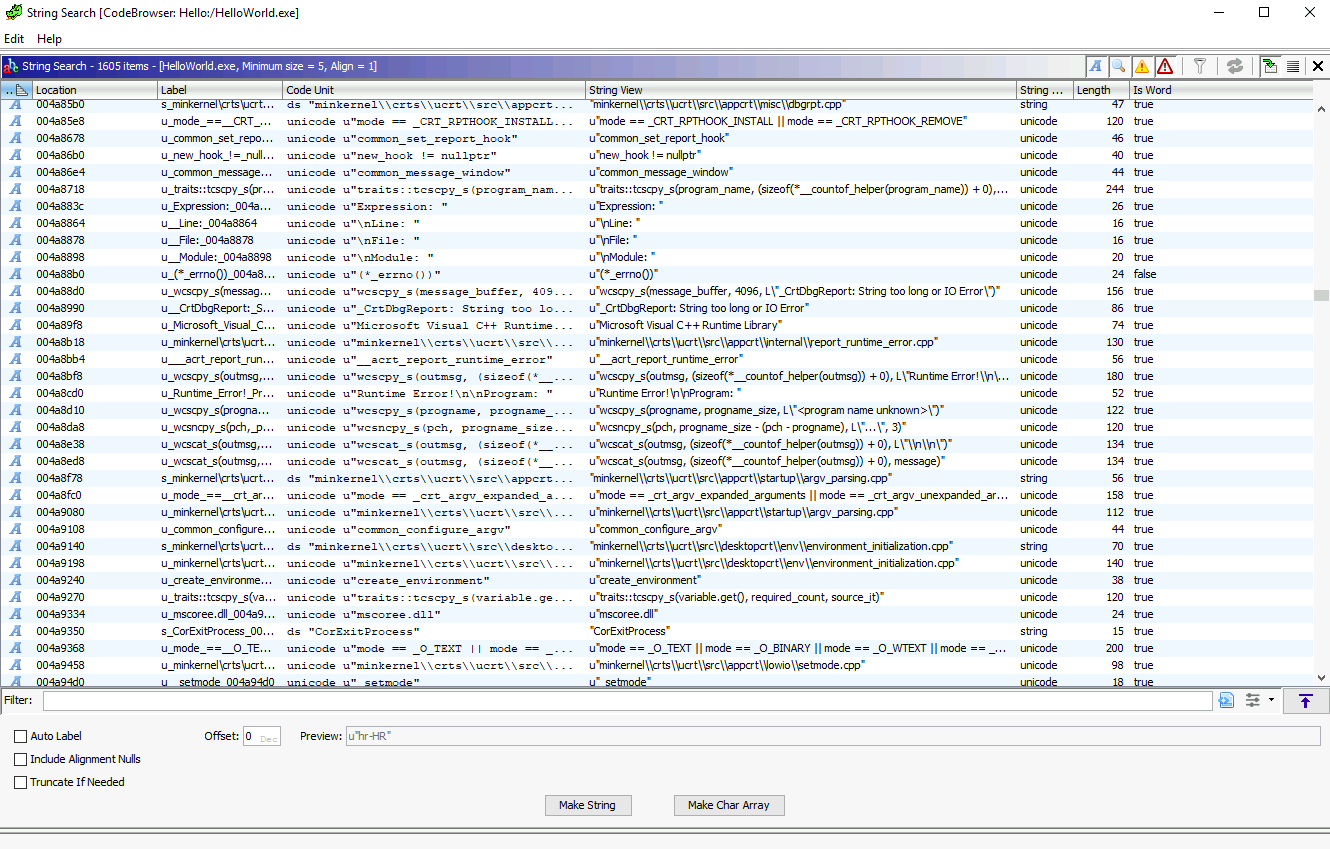
Identifying C code constructs in Assembly
Analyzing the assembly code of the compiled binary can be overwhelming for beginners. Understanding the assembly instructions and how various programming components are translated/reflected into the assembly is important. Here, we will examine various C constructs and their corresponding assembly code. This will help us identify and focus on the key parts of the malware during analysis.
Warning
Different compilers add their own code for various checks while compiling.
Therefore expect some garbage assembly code that does not make sense.
There are different approaches to begin analyzing the disassembled code:
- Locate the
mainfunction from theSymbol Treesection. - Check the
.textcode from theProgram Treessection to see the code section and find the entry point. - Search for interesting
stringsand locate the code from where those strings are referenced.
Hello World example
C code:
Assembly code:
section .data
    message db 'HELLO WORLD!!', 0

section .text
    global _start

_start:
    ; write the message to stdout
    mov eax, 4      ; write system call
    mov ebx, 1      ; file descriptor for stdout
    mov ecx, message    ; pointer to message
    mov edx, 13     ; message length
    int 0x80        ; call kernel
This program defines a string "HELLO WORLD!!" in the .data section and then uses the write system call to print the string to stdout.
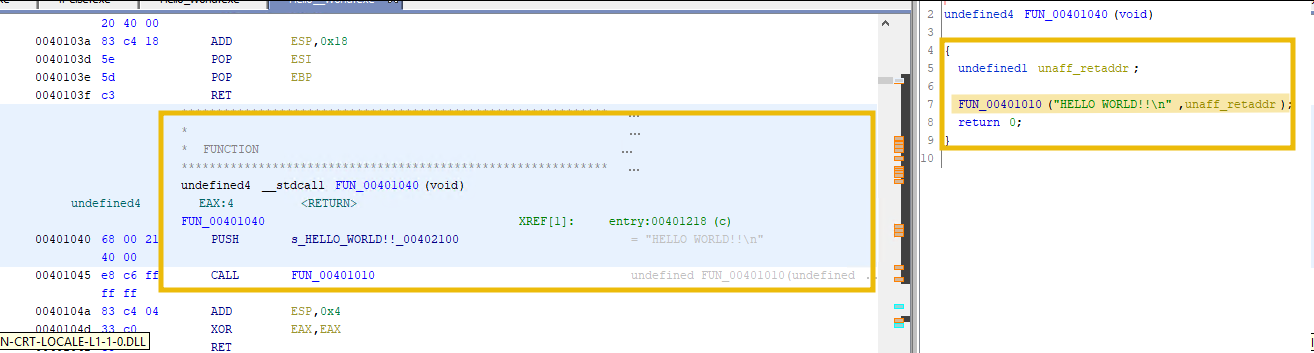
If we look at the disassembled code in the Listings View, we can see instructions to push HELLO WORLD!! to the stack before calling the print function.
For loop example
Function example
The add function starts by saving the current base pointer value onto the stack. Then, it sets the base pointer to the current stack pointer value. The function then moves the values of a and b into the eax register, adds them, and store the result in the result variable. Finally, the function moves the value of the result into the eax register, restores the previous base pointer value, and returns to the calling function.
An overview of API calls
The Windows API is a collection of functions and services the Windows Operating System provides to enable developers to create Windows applications.
These functions include creating windows, menus, buttons, and other user-interface elements and performing tasks such as file input/output and network communication.
CreateProcessA example
The CreateProcessA function creates a new process and its primary thread. The function takes several parameters, including the name of the executable file, command-line arguments, and security attributes.
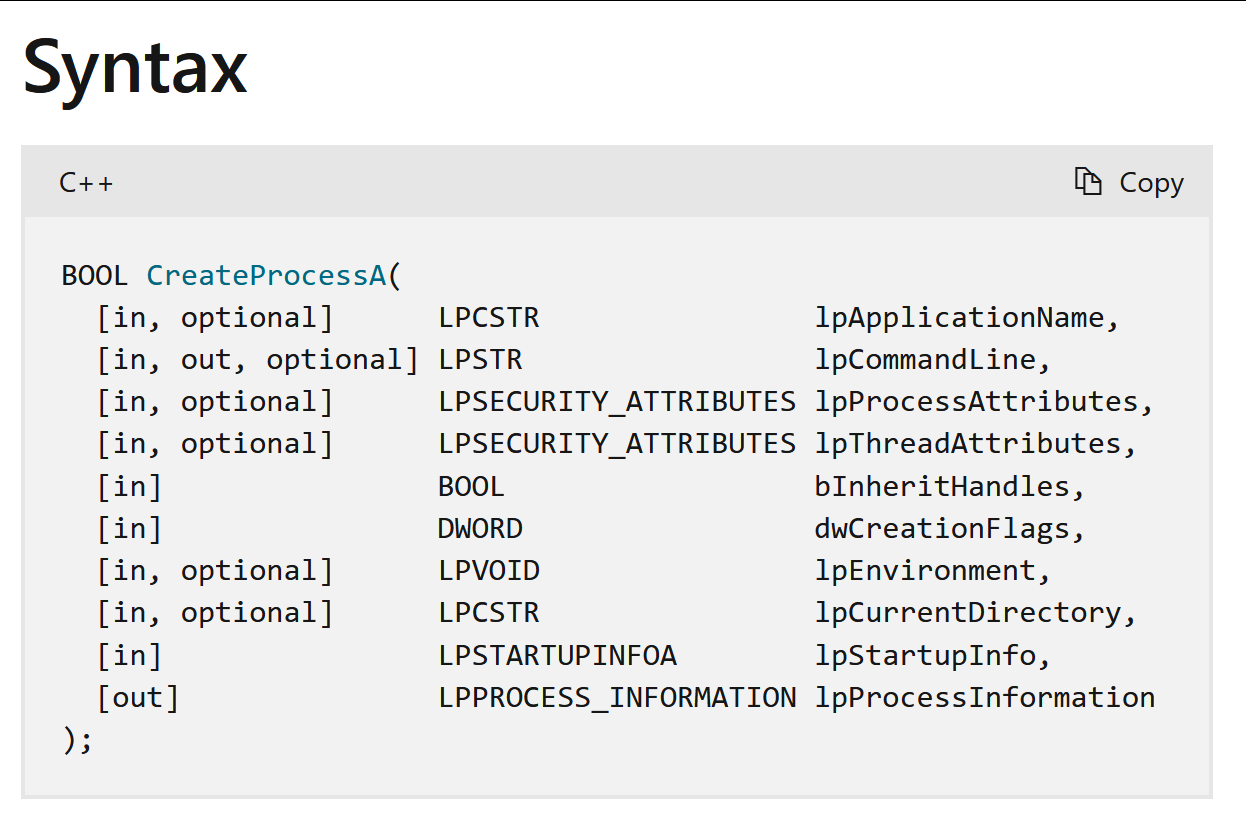
Here is an example of C code that uses the CreateProcessA function to launch a new process:
When compiled into assembly code, the CreateProcessA function call looks like this:
This assembly code pushes the necessary parameters onto the stack in reverse order and then calls the CreateProcessA function. The CreateProcessA function then launches a new process and returns a handle to the process and its primary thread.
During malware analysis, identifying the API call and examining the code can help understand the malware's purpose.
Common APIs used by Malware
Malware authors heavily rely on Windows APIs to accomplish their goals. It's important to know the Windows APIs used in different malware variants. It's an important step in advanced static analysis to examine the import functions, which can reveal much about the malware.
Keylogger
SetWindowsHookEx: Installs anapplication-defined hook procedure into a hook chain. Used tomonitor and intercept system events, such askeystrokesormouse clicks.GetAsyncKeyState: Retrieves the status of a virtual key when the function is called. Used todetermine if a key is being pressedorreleased.GetKeyboardState: Retrieves the status of all virtual keys. Used todetermine the status of all keys on the keyboard.GetKeyNameText: Retrieves thename of a key. Used todetermine the name of the pressed key.
Downloader
Designed to download other malware onto a victim's system.
URLDownloadToFile:Downloads a filefrom the internet and saves it to a local file. Used todownload additional malicious codeor updates to the malware.WinHttpOpen:Initializes the WinHTTP API. Used toestablish an HTTP connection to a remote serverand download additional malicious code.WinHttpConnect:Establishes a connectionto a remote server using the WinHTTP API. Used toconnect to a remote server and download additional malicious code.WinHttpOpenRequest:Opens HTTP requestusing the WinHTTP API. Used tosend HTTP requests to a remote serverand download additional malicious code or steal data.
C2 Communication
Command and Control (C2) communication is a method malware uses to communicate with a remote server or attacker.
InternetOpen:Initializes a session for connecting to the internet. Used toconnect to a remote server and communicate with a command-and-control (C2) server.InternetOpenUrl:Opens a URLfor download. Used todownload additional malicious codeor steal data from a C2 server.HttpOpenRequest:Opens HTTP request. Used tosend HTTP requests to a C2 server and receive commandsor additional malicious code.HttpSendRequest: SendsHTTP request to a C2 server. Used tosend data or receive commandsfrom a C2 server.
Data Exfiltration
Unauthorized data transfer from an organization to an external destination.
InternetReadFile:Reads data from a handle to an open internet resource. Used tosteal data from a compromised system and transmit it to a C2 server.FtpPutFile:Uploads a file to an FTP server. Used toexfiltrate stolen data to a remote server.CreateFile:Creates or opens a file or device. Used toread or modify files containing sensitive informationorsystem configuration data.WriteFile:Writes data to a file or device. Used towrite stolen data to a file and then exfiltrate itto a remote server.GetClipboardData: Used toretrieve data from the clipboard. Used toretrieve sensitive data that is copied to the clipboard.
Dropper
Designed to install other malware onto a victim's system.
CreateProcess:Creates a new process and its primary thread. Used toexecute its code in the context of a legitimate process, making it more difficult to detect and analyze.VirtualAlloc: Reserves or commits a region of memory within the virtual address space of the calling process. Malware can use this function toallocate memory to store its code.WriteProcessMemory: Writes data to an area of memory within the address space of a specified process. Used towrite its code to the allocated memory.
API Hooking
Intercept calls to Windows APIs and modify their behavior.
GetProcAddress:Retrieves the address of an exported function or variablefrom a specified dynamic-link library (DLL). Used tolocate and hook API calls made by other processes.LoadLibrary: Loads a dynamic-link library (DLL) into a process's address space. Used toload and execute additional code from a DLL or other module.SetWindowsHookExThis API is used toinstall a hook procedure that monitors messages sent to a window or system event. Used tointercept calls to other Windows APIs and modify their behavior.
Anti-debugging and VM detection
Evade detection and analysis by security researchers.
IsDebuggerPresent: Checks whether a process is running under a debugger. Used todetermine whether it is being analyzedand take appropriate action to evade detection.CheckRemoteDebuggerPresent: Checks whether a remote debugger is debugging a process. Used todetermine whether it is being analyzedand take appropriate action to evade detection.NtQueryInformationProcess: Retrieves information about a specified process. Used todetermine whether the process is being debuggedand take appropriate action to evade detection.GetTickCount: Retrieves the number of milliseconds that have elapsed since the system was started. Used todetermine whether it is running in a virtualized environment, which may indicate that it is being analyzed.GetModuleHandle: Retrieves a handle to a specified module. Used todetermine whether it is running under a virtualized environment, which may indicate that it is being analyzed.GetSystemMetrics: Retrieves various system metrics and configuration settings. Used todetermine whether it is running under a virtualized environment, which may indicate that it is being analyzed.
Read more on malapi.io to learn about APIs used in different malware families.
Analyzing process hollowing
Let's take analyze a code sample that uses process hollowing.
An important point to note is that almost all malware comes packed with known or custom packers and also have employed different Anti-debugging / VM detection techniques to hinder the analysis.
This sample is not packed and has no Anti-debugging / VM detection techniques is applied.
Our objective of advanced static analysis would be to:
- Examine the API calls to find a pattern or suspicious call.
- Look at the suspicious strings.
- Find interesting or malicious functions.
- Examine the disassembled/decompiled code to find as much information as possible.
Warning
It's important to mention that starting to search for the CreateProcessA function right away is not how an analyst would start analyzing an unknown binary. This whole example is just to get comfertable with Ghidra.
CreateProcess
The suspicious process creates a victim process in the suspended state.
To confirm, let's search for the CreateProcessA API in the Symbol Tree section.
Then, right-click on the Show References to option to display all the program sections where this function is called.
Clicking on the first reference will take us to the disassembled code and show the decompiled C code in the Decompile section.
It clearly shows how the parameters on the stack are being pushed in reverse order before calling the function. The value 0x4 in the process creation flag is being pushed into the stack, representing the suspended state.
Graph View
Clicking on the Display Function Graph in the toolbar will show the graph view of the disassembled code we are examining.
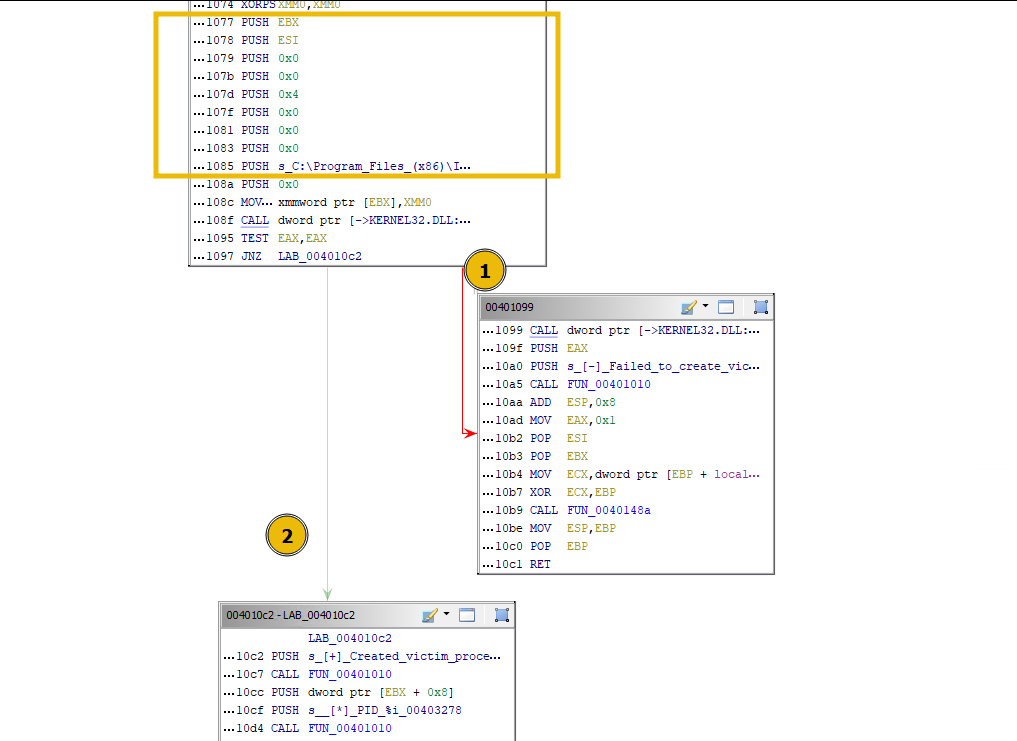
In the above case, if the program:
- Fails to create a victim process in the suspended state, it will move to block 1. The
red arrow represents the failureto meet the condition mentioned above. - Successfully creates the victim process, it will move to block 2. The
green arrow represents the successof the jump condition.
Example of further analysis
-
Opening a suspicous file
The CreateFileA API is used to either create or open an existing file.
-
Hollowing the process
Malware use ZwUnmapViewOfSection or NtUnmapViewOfSection API calls to unmap the target process's memory.
NtUnmapViewOfSection takes exactly two arguments, the base address (virtual address) to be unmapped and the handle to the process that needs to be hollowed.
-
Allocating memory
Once the process is hollowed, malware must allocate the memory using VirtualAllocEx before writing the process.
Arguments passed to the function include a handle to the process, address to be allocated, size, allocation type, and memory protection flag.
-
Writing down the memory
Once the memory is allocated, the malware will attempt to write the suspicious process/code into the memory of the hollowed process. The WriteProcessMemory API is used for this purpose.
There were three calls to the WriteProcessMemory Function. The last call references to the code in the Kernel32 DLL; therefore, we can ignore that. From the decompiled code, it seems the program is copying different sections of the suspicious process one by one.
-
Resuming the thread
Once all is sorted out, the malware will get hold of the thread using the SetThreadContext and then resume the thread using the ResumeThread API to execute the code.