Basic Dynamic analysis
As we have learned, malware can use techniques to hide its features from a malware analyst. But no matter how good malware hides its features from static analysis, its primary purpose is to execute. And when malware executes, it leaves traces that a malware analyst can use to identify if it's malicious.
Sandboxing
It has been emphasized that malware should only be analyzed in a controlled environment, ideally a virtual machine. However, this becomes increasingly important for the dynamic analysis of malware.
The primary concern regarding performing static analysis on malware in a live environment is an accidental execution, but we intentionally execute malware in a dynamic analysis scenario.
In the Intro to Malware Analysis, we learned about some automated sandboxes to help perform dynamic analysis. Below, we will learn about some tools to help create our sandbox, which gives us more analysis control.
Virtualization
A lot of commercial and free tools are available for virtualization:
- Oracle's VirtualBox
- VMware's Player and Workstation
These three tools allow us to create Virtual Machines isolated from our local machine.
Warning
However, VMWare Player can't create snapshots.
For dynamic analysis of malware, snapshot creation is a critical requirement, which makes VMWare Player unsuitable for malware analysis. VMWare Workstation and VirtualBox have the snapshot creation option and are, therefore, suitable for malware analysis.
Apart from these, server-based virtualization software like XenServer, QEmu, ESXi, etc., help with virtualization on a dedicated server. This type of setup is often used by enterprises for their virtualization needs. Security research organizations often use similar technologies to create a VM farm for large-scale virtualization.
ProcMon
ProcMon is part of the Sysinternals suite, a set of utilities created by a company named Winternals Software and purchased by Microsoft in 2006. Sysinternals consists of many handy utilities that provide advanced functionalities for Windows.
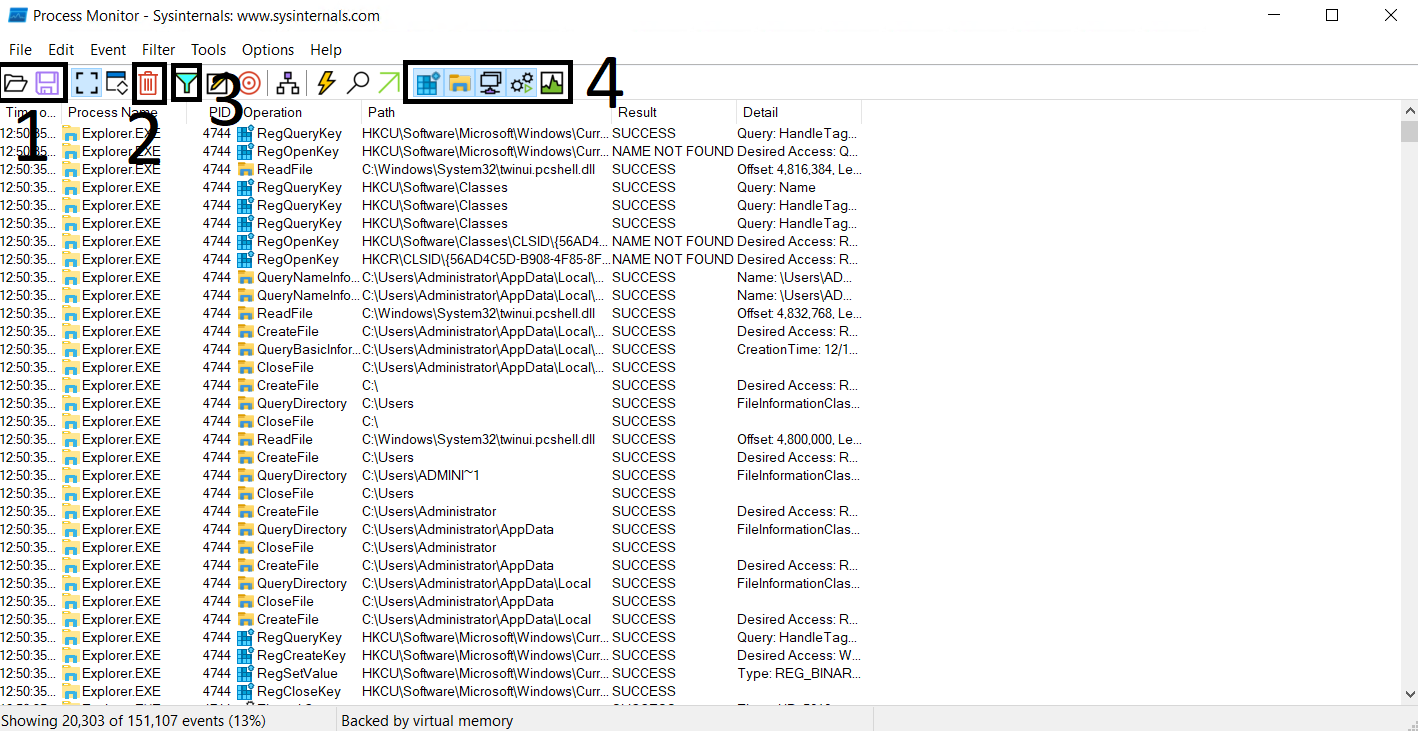
The controls of ProcMon are self-explanatory, and a brief description is shown if we hover over one of the controls. The labels in the screenshot show some of the critical controls of the data visible below these controls.
- Shows the Open and Save options. These options are for opening a file that contains ProcMon events or saving the events to a supported file.
- Shows the Clear option. This option clears all the events currently being shown by ProcMon. It is good to clear the events once we execute a malware sample of interest to reduce noise.
- Shows the Filter option, which gives us further control over the events shown in the ProcMon window.
- These are toggles to turn off or on Registry, FileSystem, Network, Process/Thread, and Profiling events.
Below these controls, we can see from left to right the Time, Process, Process ID (PID), Event Name, Path, Result and Details of the activity. We can observe that events are shown in chronological order. Generally, ProcMon will show an overwhelming number of events occurring on the system. For ease of analysis, it is wise to filter the events to those of our interest.
Filtering events
If we right-click on the process column on the process of our choice, a pop-up menu opens up. We can see different options in the pop-up menu. Some of these options are related to filtering. For example, if we choose the option Include 'Explorer.EXE', ProcMon will only show events with Process Name Explorer.EXE. If we choose the option Exclude 'Explorer.EXE', it will exclude Explorer.EXE from the results. Similarly, we can right-click on other columns of the events window to filter other options.
Also, when we right-click on an event, we can filter in/out an event. Similarly, we can add more filters to the results until we narrow down the results to the events of our interest. If we choose the Include 'Explorer.EXE' and Include 'CreateFile' events, ProcMon will only show us CreateFile events triggered by Explorer.EXE.
Advanced filtering
ProcMon also allows us to implement advanced filters. In the menu marked as number 3 in the image above, we can see the option for filtering. When we click on this option, we see a window pop up.
We can see some preset filters already applied in ProcMon, like the one for filtering out Procmon.exe. We can see that the filter process is quite simple to implement. We select filtering values, like Process Name, its relation, value, and action. If the checkbox is ticked, the filter is applied. Otherwise, the filter is ignored.
Process tree
rocMon also allows us to view all the existing processes in a parent-child relationship, forming a process tree. This can be done by clicking the Process Tree icon in the menu. This option helps identify the parents and children of different processes. As shown by ProcMon, an example process tree can be seen below.
API logger and API monitor
The Windows OS abstracts the hardware and provides an Application Programmable Interface (API) for performing all tasks. For example, there is an API for creating files, an API for creating processes, an API for creating and deleting registries and so on. Therefore, one way to identify malware behaviour is to monitor which APIs a malware calls. The names of the APIs are generally self-explanatory. However, Microsoft Documentation can be referred to for finding information about the APIs.
API logger
The API Logger is a simple tool that provides basic information about APIs called by a process.
To open a new process, we can click the highlighted three-dot menu. When clicked, a file browser allows us to select the executable for which we want to monitor the API calls. Once we select the executable, we can click 'Inject & Log' to start the API logging process. We will see the log of API calls in the lower pane. In the upper pane, we see the running processes and their PIDs.
We can see the PID of the process we monitor and the API called with basic information about the API in the 'msg' field.
We can click the 'PID' menu for the API logger to log API calls of a running process. It will open the Choose Process window.
This Window shows processes with PIDs, the User that ran that process, and the image path of the process. The rest of the process is the same as the case with starting our process.
API monitor
The API Monitor provides more advanced information about a process's API calls. API Monitor has 32-bit and 64-bit versions for 32-bit and 64-bit processes, respectively. When we open API Monitor, we see the following Window.
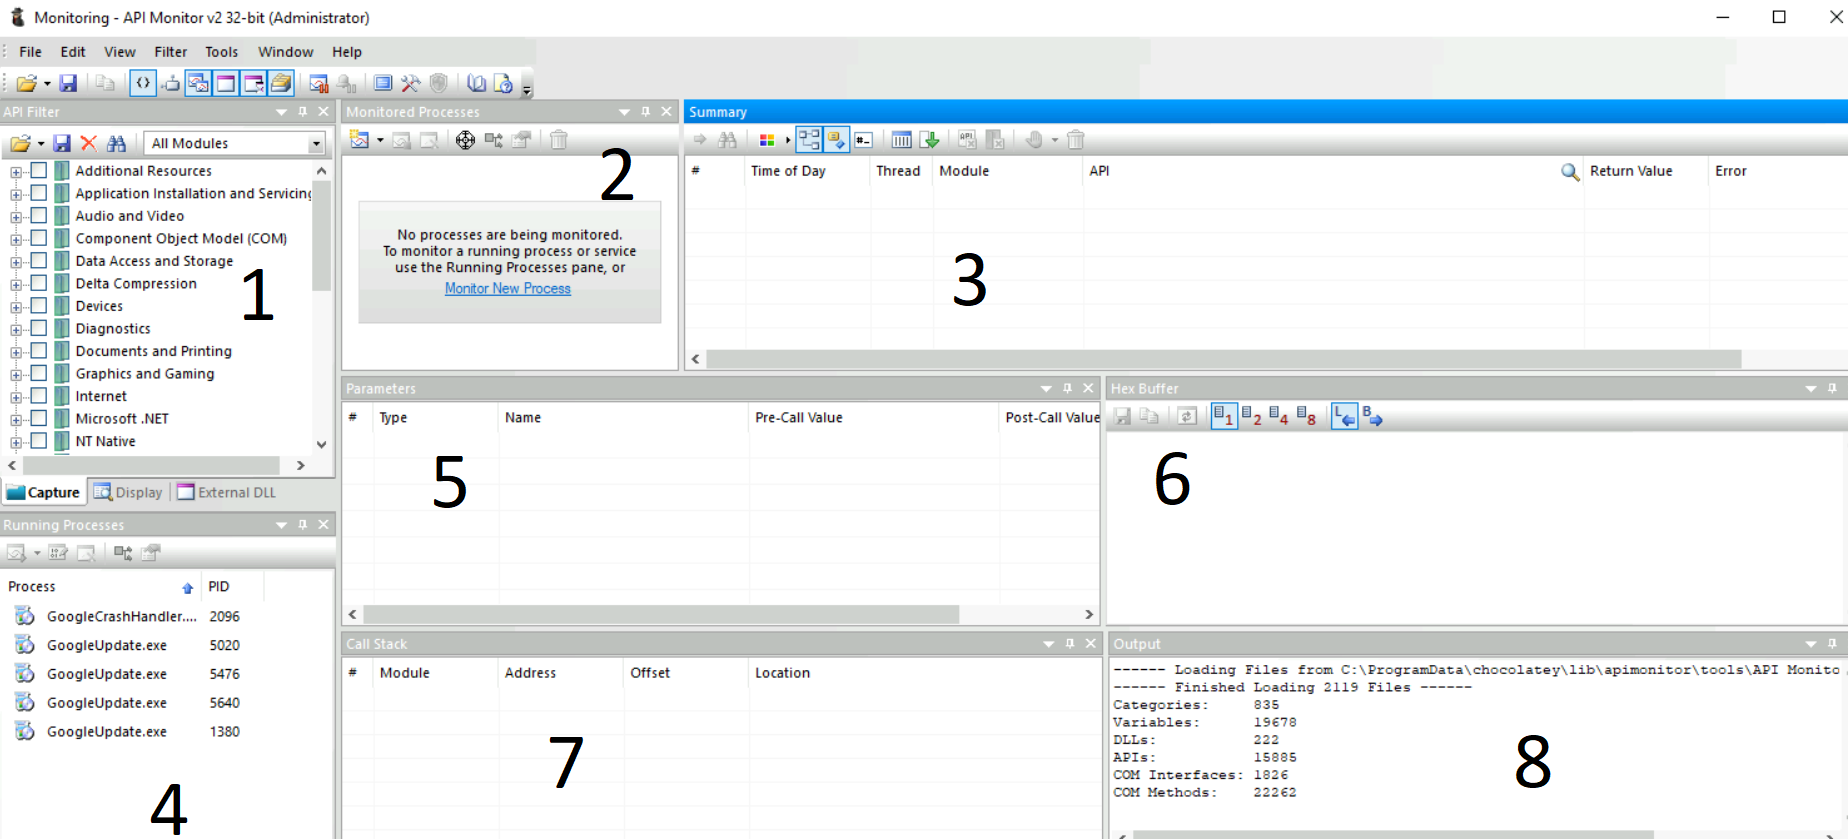
As we can see, API Monitor has multiple tabs, as numbered in the image above:
- This tab is a filter for the API group we want to monitor. For example, we have a group for 'Graphics and Gaming' related APIs, another for 'Internet' related APIs and so on. API Monitor will only show us APIs from the group we select from this menu.
- This tab shows the processes being monitored for API calls. We can click the 'Monitor New Process' option to start monitoring a new process.
- This tab shows the API call, the Module, the Thread, Time, Return Value, and any errors. We can monitor this tab for APIs called by a process.
- This tab shows running processes that API Monitor can monitor.
- This tab shows the Parameters of the API call, including the values of those Parameters before and after the API calls.
- This tab shows the Hex buffer of the selected value.
- This tab shows the Call Stack of the process.
- This tab shows the Output.
Process explorer
Process Explorer is another very useful tool from the Sysinternals Suite. It can be considered a more advanced form of the Windows Task Manager. Process Explorer is a very powerful tool that can help us identify process hollowing and masquerading techniques.
Upon opening we see all the different processes running in the system in a tree format. We can also see their CPU utilization, memory usage, Process IDs (PIDs), Description, and Company name. We can enable the lower pane view from the 'View' menu to find more information about the processes.
When we select a process in the upper pane, we can see details about that process in the lower pane. Here, we see the Handles the process has opened for different Sections, Processes, Threads, Files, Mutexes, and Semaphores. Handles inform us about the resources being used in this process. If another process or a thread in another process is opened by a process, it can indicate code injection into that process. Similarly, we can see DLLs and Threads of the process in the other tabs of the lower pane.
For some more details about a selected process, we can look at the properties of the process. We can do that by right-clicking the process name in the process tree and selecting 'Properties'.
Regshot
Regshot is a tool that identifies any changes to the registry (or the file system we select). It can be used to identify what registry keys were created, deleted, or modified during our dynamic analysis by malware. Regshot works by taking snapshots of the registry before and after the execution of malware and then comparing the two snapshots to identify the differences between the two.
When we execute Regshot, we see the following interface:
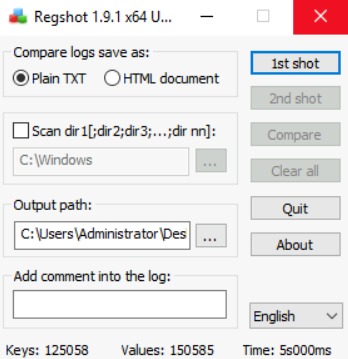
In this simple interface, if we select the Scan dir1 option, we can also scan for changes to the file system. However, for the sake of brevity, we will only cover registry changes. To start, we can click on the '1st shot' option. It will ask us whether to take a shot or take a shot and save.
Now that we have saved a shot of the registry, we can execute the malware. Once we have executed the malware and are confident that it has performed its malicious activity, we take a 2nd shot. For this, we click the '2nd shot' option.
Now that we have both shots, we can compare them to identify the registry changes performed by the malware. We do that by clicking the 'Compare' option. Now, we will see a summary. Notice that it shows Keys and Values that were added, deleted, and modified. It also shows changes to Files and Folders.
We see zero changes to Folders and Files because we had disabled 'Scan dir1' while taking the shots. If we had enabled this option and provided directories to monitor, we would have seen details about filesystem changes made by the malware in our selected directories.
One advantage that Regshot enjoys over all the other tools discussed is that it does not need to be running when we execute the malware. Some malware can check all the running processes and shut down if any analysis tool is running. When analyzing, we might often encounter malware samples that check for ProcExp, ProcMon, or API Monitor before performing any malicious activity and quitting if these processes are found.
On the flip side, we must ensure that no other process is running in the background while performing analysis with Regshot, as there is no filtering mechanism in Regshot, as we saw in the other tools. Hence, any noise created by background processes will also be recorded by Regshot, resulting in False Positives.