Dynamic Analysis: Debugging
In Basic Dynamic Analysis, we learned to identify malware traces in the infected system during execution. However, malware authors understand that the malware will be analyzed and want to thwart it. This can be done through various evasion techniques.
To defeat these evasion techniques, a malware analyst desires more control over malware execution.
The Need for Advanced Dynamic Analysis
Analyzing malware is like a cat-and-mouse game. Malware analysts keep devising new techniques to analyse malware, while malware authors devise new techniques to evade detection.
Evasion of static analysis
Malware often hides or tries to look like legitimate software to evade the prying eyes of a malware analyst. Because we are not executing the malware during static analysis, the main focus of evading static analysis is to obfuscate the true functionality of the program until the program is executed.
The following techniques can be commonly used to achieve this:
-
Changing the hash: We have learned previously that every file has a unique hash. Malware authors exploit this functionality byslightly changing their malware. This way, the malware's hash changes, bypassing the hash-based detection mechanism. Hashes can change even if one bit of the malware is changed (unless we are talking Context-Triggered Piecewise Hashes or fuzzy hashes), sojust adding a NOP instruction or other such change can defeat the hash-based detectiontechniques. -
Defeating AV signatures: Anti-virus signatures and other signature-based detection often depend on static patterns found inside malware. Malware authorschange those patterns to try to evade signatures. This technique is oftenaccompanied by general obfuscationof malware code. -
Obfuscation of strings: Some malware authors obfuscate the strings in malware bydecoding them at runtime. When we search the malware for strings, we might find nothing useful. However, when the malware runs, it decodes those strings during execution. Malware authors might obfuscateimportant strings, such as URLs,C2 domains,etc., to avoid burning the infrastructure based on a single-string search. -
Runtime loading of DLLs: Since we can identify malware imports while analyzing PE headers, malware authors often use the Windows libraries'LoadLibraryorLoadLibraryExtoload a DLL at runtime. When analyzing this malware statically, we might not see all the functions it is linked to while analyzing its headers. -
Packing and Obfuscation: Packing is very popular amongst malware authors. Packing malware is like packing a present. When we look at a packed present, we can't say what might be inside it unless we unpack the wrapper and take out the present. Similarly,packers pack the malware in a wrapper by writing code that decodes the malware at runtime. So when performing static analysis, we might be unable to see what is inside the packer. However, when we execute the malware, it unpacks the code, loads the actual malicious code into the memory, and then executes it.
As we might have observed, most of these techniques are suitable for hiding in plain sight, but they can be defeated when the malware is executed while performing dynamic analysis.
Evasion of Basic dynamic Analysis
Malware authors do not just accept their fate and let dynamic analysis detect their samples. For evasion of dynamic analysis, a host of techniques are employed. These techniques generally depend on identifying whether the malware runs in a controlled analysis environment.
-
Identification of VMs: Though some of these techniques might backfire nowadays since a lot of enterprise infrastructure is hosted on VMs, one of the favourites of malware authors has been to identify if the malware is running inside a VM. For this, malware oftenchecks for registry keys or device drivers associated with popular virtualization softwaresuch as VMWare and Virtualbox. Similarly,minimal resources, such as a single CPU and limited RAM, might indicate that the malware is running inside a VM. In this scenario, malware will take a different execution path that is not malicious to fool the analyst. -
Timing attacks: Malware will often try totime out automated analysis systems. For example, when malware is executed, it will try tosleep for a day using the Windows Sleep library. After a few minutes, theautomated analysis system will shut down, finding no traces of malicious activity. Newer malware analysis systems can identify these attacks and try to mitigate them by shortening the time the malware sleeps. However, malware can identify those mitigations by performing targeted timing checks to see if the time is being manipulated. This can be done bynoting the time of execution and comparing it with the current time after the execution of the sleep call. -
Traces of user activity: Malware tries to identify if there are traces of user activity in the machine. If no or very few traces are found, malware will decide that it is being executed inside a controlled system and take a different, benign execution path. Traces of user activity can includeno mouse or keyboard movement,lack of browser history,no recently opened files,little system uptime, etc. -
Identification of analysis tools: Malware can ask the Windows OS for arunning process list using Process32First,Process32Next, or similar functions. If popular monitoring tools are identified among thelist of running processes, malware can take a benign execution path. For example, ifProcMonorProcExpis running, malware can identify that and switch to benign activities. Another way to identify analysis tools is bylooking at the names of different windows open in a system. If the malware findsOllydbgorProcMonin the open Windows, it can switch to a different execution path.
By employing these techniques, malware authors make it difficult for malware analysts to perform analysis. However, malware analysts can use some tools and techniques to take greater control over malware execution, helping them defeat these evasion techniques.
Introduction to debugging
The term Debugging is widely used by software programmers to identify and fix bugs in a program. Similarly, a malware sample trying to evade detection or reverse engineering can also be considered a program having a bug. A malware reverse engineer often has to debug a program to remove any roadblocks that prevent it from performing its malicious activity. Therefore, interactive debugging becomes an essential part of advanced malware analysis. Debuggers provide a malware analyst with the control desired to monitor a running program more closely, looking at the changes in different registers, variables, and memory regions as each instruction is executed. A debugger also allows a malware analyst to change the variables' values to control the program's flow at runtime, providing greater control over the execution path the malware follows.
Types of Debuggers
We can loosely categorize debuggers into one of the following three categories.
Source-Level Debuggers
Source Level Debuggers work on the source code level. Most software programmers use source-level debuggers while writing code to check their code for bugs. A source-level debugger is a high-level debugger compared to the other two options. When using a source-level debugger, we often see the local variables and their values.
Assembly-Level Debuggers
When a program has been compiled, its source code is lost and can't be recovered. This is the case with malware analysis. We don't have the malware's source code we are investigating; instead, we have a compiled binary. An assembly-level debugger can help us debug compiled programs at the assembly level. While debugging with an assembly-level debugger, we often see the CPU registers' values and the debuggee's memory. This is the most common type of debugger used for malware reverse engineering. The debugger attaches to the program that has to be debugged and executes it as per the analyst's desire.
Kernel-Level Debuggers
Kernel-level debuggers are a step even lower than assembly-level debuggers. As the name suggests, these debuggers debug a program at the Kernel Level. For this level of debugging, generally, two systems are required. One system is used for debugging the code running on the other system. This is because if the kernel is stopped using a breakpoint, the whole system will stop.
Familiarization With a Debugger
For malware analysis, there are many options to choose a debugger from. These options include Windbg, Ollydbg, Scdbg, Cheat Engine, etc.
For this example, we will be using x32dbg and x64dbg. Upon opening the application we will be greeted by this interface:
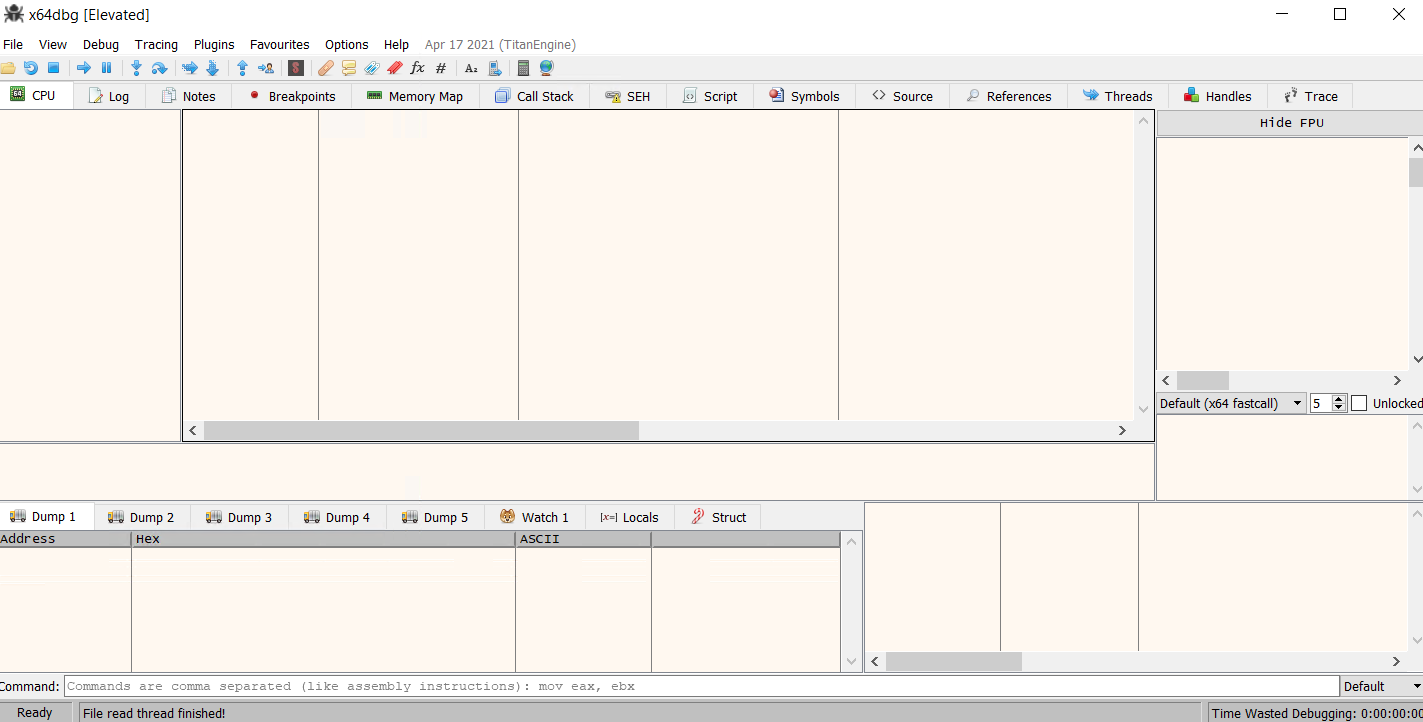
To open a file in the debugger, we can navigate to File > Open and open our desired file. We are currently seeing the CPU tab in the interface.
Warning
Please note that we must use x32dbg for 32-bit samples and x64dbg for 64-bit samples.
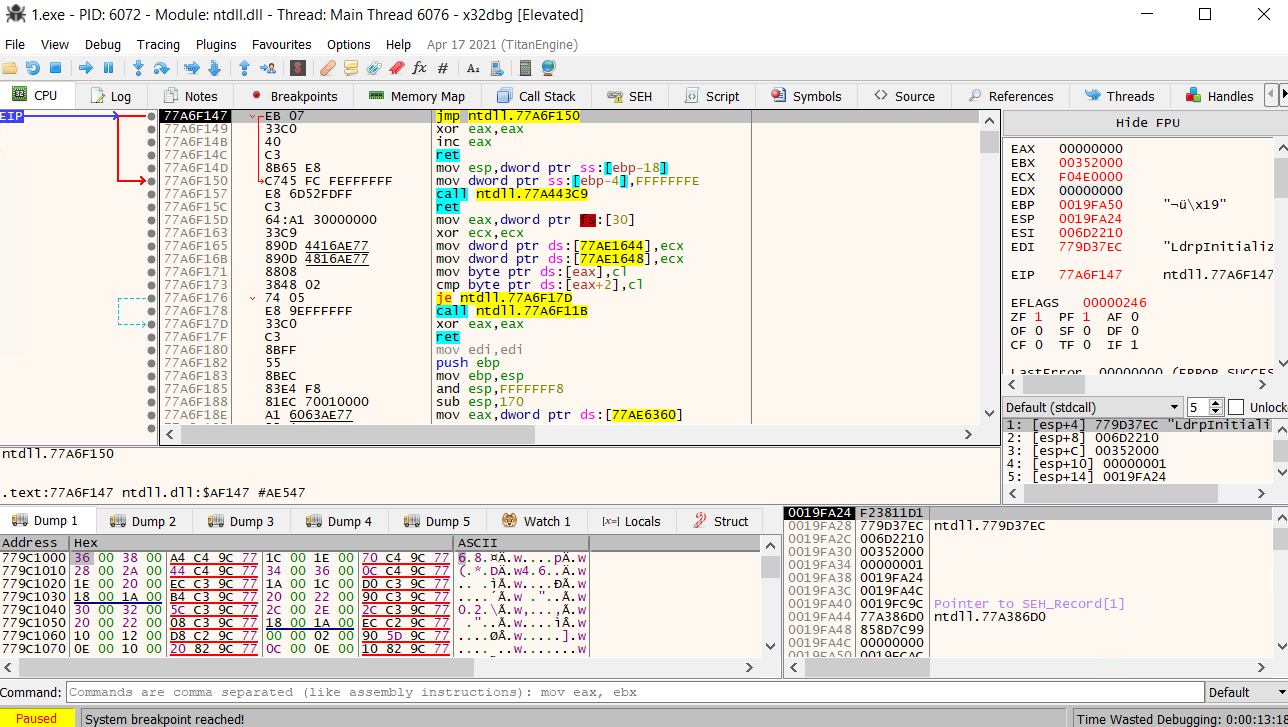
As we can see in the bottom left corner, the execution of the program is paused because a System breakpoint has been reached. We can control whether to execute one instruction at a time or the whole program. But before that, let's take a look at the screenshot above. Here, we can see Disassembly in the middle pane, with the Instruction pointer pointing to the next instruction executed if we start the program. In the right pane, we can see the registers and their values. We can note that the value in EIP is the address EIP is pointing to in the disassembly pane. Similarly, on the bottom pane, we can see the stack view (right), the dump view (left), and the timer showing the time we spent debugging the sample (right corner).
Warning
x32-x64dbg is programmed to break execution on TLS callbacks
We can set where to put automatic breakpoints on a program by going to the Options > Preferences menu.
Let's look at some of the other tabs. The breakpoints tab shows the current status of breakpoints. Breakpoints are points where the execution of the program is paused for the analyst to analyze the registers and memory. A breakpoint on a specific instruction can be enabled by clicking the dot in front of that instruction in the CPU tab.
- The Memory Map shows the memory of the program.
- We can also take a look the Call stack of the program.
- The threads running in the program are shown in the threads tab.
- Any handles to files, processes, or other resources the process accesses are shown in the handles tab.